The first step in holistically solving a data quality problem is to define the problem precisely by addressing the real or the root cause of the problem. Root cause analysis (RCA) is a systematic process for identifying “root causes” of problems and is based on the idea that effective management lies in proactively preventing the underlying problems once for all. It is a collective term that describes a wide range of approaches, tools, and techniques used to uncover causes of problems. RCA goes beyond treating symptoms, but instead looks at the underlying problems that contribute to a problem or event. So, how can one identify the root cases of a problem and improve the data quality in a company? Below are the four most common techniques that can help to identify the root causes of the data quality issues.
1. Affinity Diagram
Categorization is the first and fundamental step in effective management. Affinity Diagram is a technique that gathers large amounts of data (ideas, opinions, and issues) and organizes them into groups or categories based on their associations or relationships for further analysis. This model categorizes these elements into smaller homogenous or similar classes according to their similarity.
2. Failure Mode and Effects Analysis (FMEA)
Once we have a list of issues that are logically classified and labelled using the Affinity diagram, we need to look to the impact of these issues on the business. FMEA is a technique that is used to identify the data quality problems or the modes of failure. In FMEA, each failure mode or data quality issue is assessed for Severity (S), Occurrence (O) and Detection (D). The combination of the three scores produces a risk priority number (RPN) which can then be used to derive a ranking system to prioritize the problem categories.
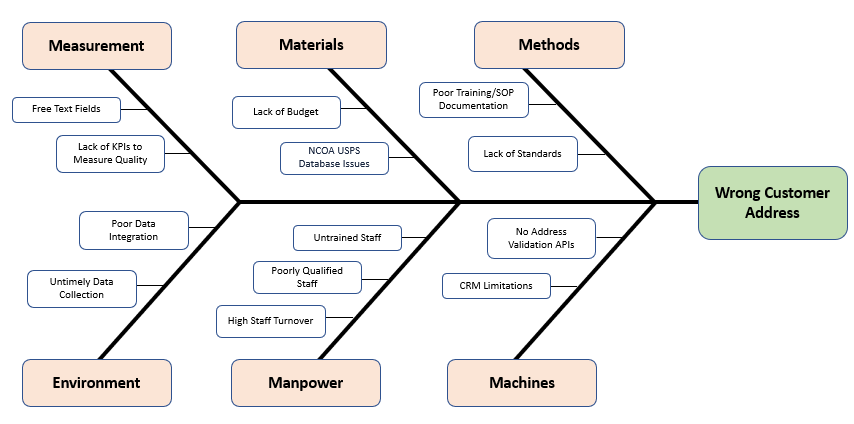
3. Fishbone or Cause-and-Effect Diagram
Once we have a prioritized list of data quality problems based on the RPN scores, the fishbone diagram can be used. Also called a cause-and-effect or Ishikawa diagram, a fishbone diagram shows multiple sub-causes branching off of each identified issue or symptom. The fishbone diagram uses 6M classes as a methodology for identifying the root cause and is as shown below.
4. The 5-Whys Method
To further deep dive into the individual issues, the 5-Whys methods is very useful. The 5-Whys method uses a series of questions to drill down into successive layers of a problem. The basic idea is that each time you ask why, the answer becomes the basis of the next why. Below is a simple example of the 5Why Technique.
1. Why didn’t the Data Pipeline routine get deployed on time?
– Because the development could not be completed on time.
2. Why were the development not completed on time?
– Because the testing the application took a lot of time.
3. Why did testing the application took a lot of time?
– Because there was no quality data available to test.
4. Why was data quality poor?
– Because data was manually entered by poorly trained users.
5. Why were the users not trained?
– Because we do not have a data literacy program in the company.
Now we know that the Data Pipeline routine did not get deployed on time because there no data literacy program in the company.
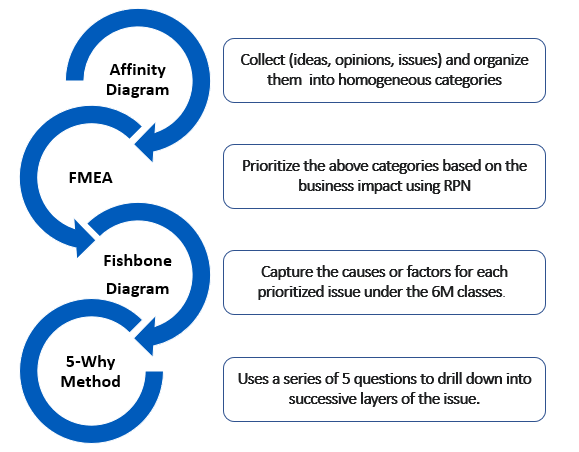
Below is an integrated view of applying these four RCA techniques to determine the root cause of a data quality problem.
In this backdrop, Uarrow Cloud offers an end-end Data Quality (DQ) assessment and Data remediation solutions by addressing the root causes. Specifically, Uarrow Cloud improves the data quality using two main approaches – proactive assessment and remediation. The Data Quality (DQ) assessment and remediation functionalities include Data Profiling, Data Cleansing, Critical Data Elements (CDE) management, Dashboards, Notifications, No Code DQ, Threshold by DQ Dimensions, and more. Uarrow Cloud platform is also integrated with the JIRA, SLACK, Email notifications for automated testing and DQ Data. Overall, the Uarrow Cloud helps in improving the time to insights with performance, scalability, and data security/privacy and can be deployed on existing database, transactional systems, data warehouse, semantic layer or even the data lake. For more details visit. https://uarrow.cloud/
About the Author
 Dr. Prashanth Southekal is the Managing Principal of DBP Institute (www.dbp-institute.com), data and analytics consulting, research and education firm. He is a Consultant, Author, and Professor. He has consulted for over 75 organizations including P&G, GE, Shell, Apple, and SAP. Dr. Southekal is the author of two books — “Data for Business Performance” and “Analytics Best Practices” — and writes regularly on data, analytics, and machine learning in Forbes.com, FP&A Trends, and CFO.University. ANALYTICS BEST PRACTICES.
is in the top 100 analytics books of all time and in May 2022 was ranked #1 by BookAuthority. Apart from his consulting pursuits, he has trained over 3,000 professionals worldwide in Data and Analytics. Dr. Southekal is also an Adjunct Professor of Data and Analytics at IE Business School (Madrid, Spain). CDO Magazine included him in the top 75 global academic data leaders of 2022.
He holds a Ph.D. from ESC Lille (FR) and an MBA from Kellogg School of Management (U.S.). He lives in Calgary, Canada with his wife, two children, and a high-energy Goldendoodle dog. Outside work, he loves juggling and cricket.